
About us
2025 community impact
Three numbers that describe a year, and the ordinary days behind them.
0
0
0
What the numbers mean
Behind each figure is a Tuesday morning
We publish counts rather than adjectives, and we publish them whether or not they went up.
63,725 meals delivered
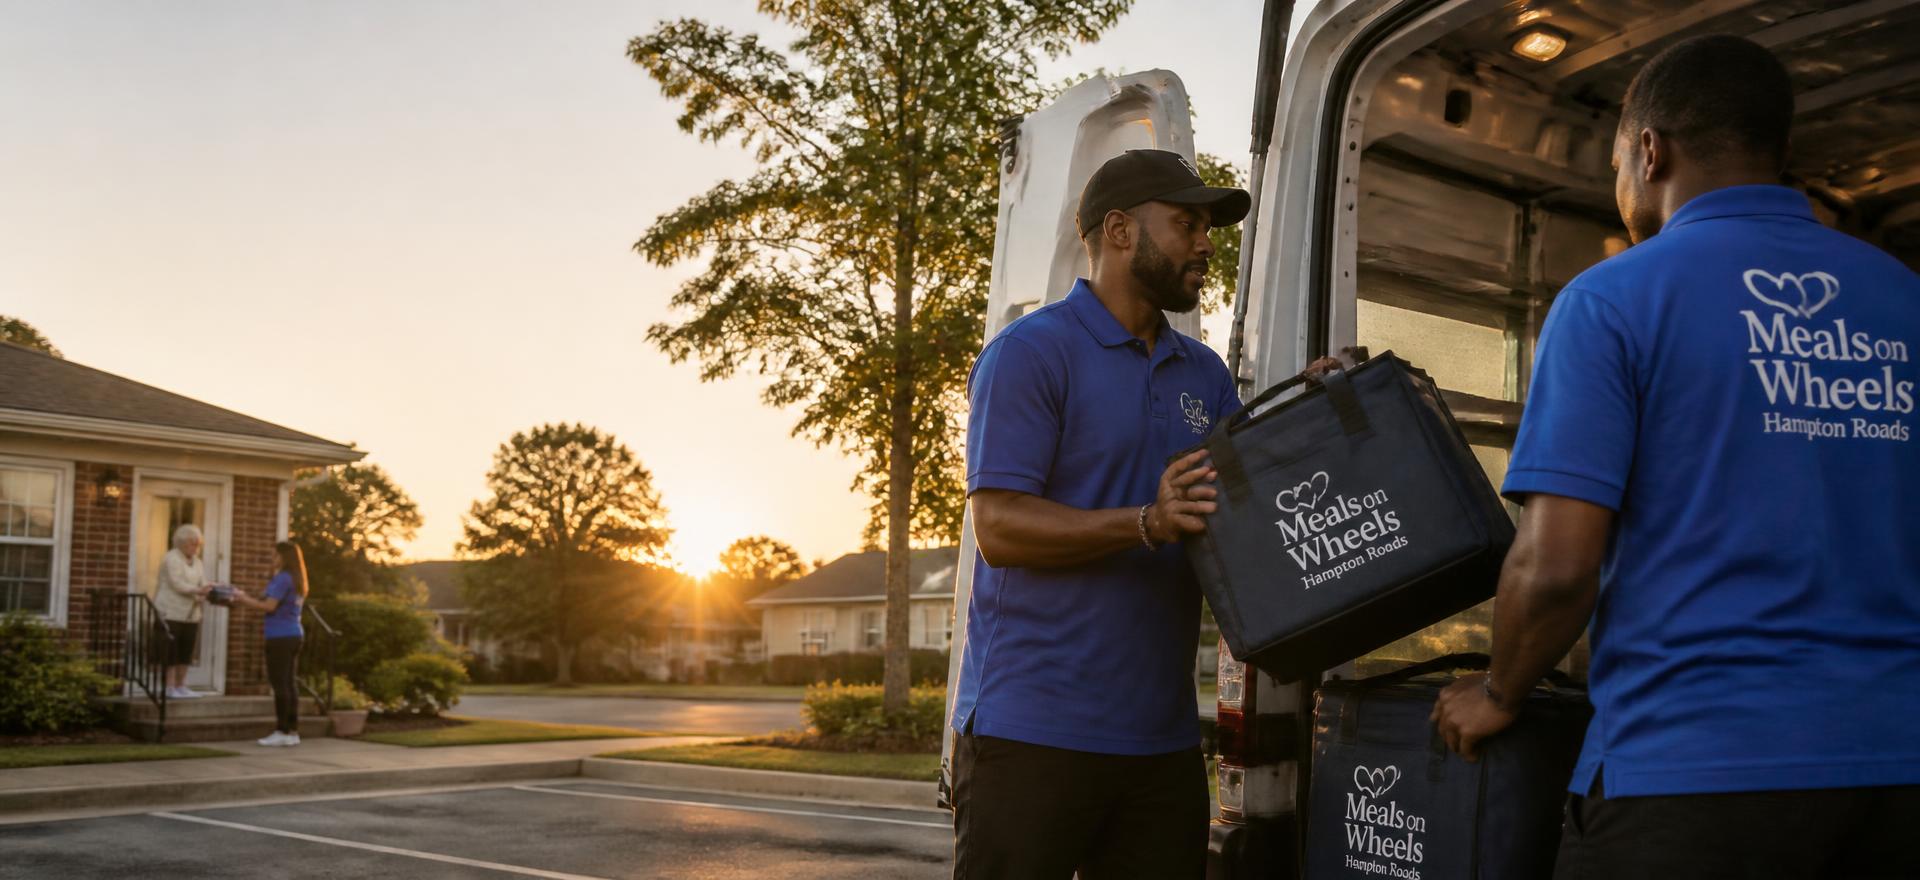
Hot midday meals to homebound neighbours plus congregate lunches at the senior centers. Every delivery is also a wellbeing check — drivers report anything that looks wrong the same day.
21,025 hours of companionship enjoyed
Friendly visiting, telephone reassurance and in-home companion care. For many participants this is the only conversation of the week that is not transactional.
20,697 rides given
I-RIDE trips to dialysis, oncology, the grocery store and the pharmacy, including wheelchair-accessible vehicles across all eight localities.
Ten programmes, one intake
Rides, meals, in-home care, care coordination, Medicare counselling, wellness, Hayden Village Center, the ombudsman, technology coaching and caregiver support — reached through a single phone call.
Where the money goes
Eighty-six cents of every dollar reaches a programme
Figures are drawn from the most recent audited financial statements. The full audit and IRS Form 990 are free to download.
- Direct programmes and services86%
- Management and general9%
- Fundraising5%
Want the underlying documents?
Audited statements, Form 990 and the full-year report are in the document library.
Twenty thousand rides is not a statistic. It is twenty thousand times somebody made it to dialysis.
Not sure what you need?
Call and describe an ordinary day. A resource specialist will work out the rest — including services that belong to other agencies.